Algonquin

Algonquin history
Algonquin, Illinois is situated 49 miles northwest of Chicago, cradled by the gently-sloping foothills of the Fox River Valley. The village has experienced considerable growth in the last fifty years, expanding from 2,000 residents in 1960 to around 30,000 today. Like many of Chicago's suburban areas, the land went through many stages to become the thriving mini-city we see now. Things kicked off in Algonquin in the mid-1830s when a group of colonists from the east coast came across the spot and decided it would be a nice place to settle down. There was an extended dispute over what they should call their newfound homeland, but a day before Christmas Eve in 1847 the townspeople concluded that Algonquin was a worthy name (it had been the name of one of the original settlers' ships), and that was that.
As time moved forward the little town of Algonquin evolved into a popular summer destination for folks who lived in Chicago. New railroad tracks connected the remote village to Chicago and provided cramped city dwellers with a lovely escape from the noise and congestion of urban life. After the turn of the century Algonquin acquired an interesting position with the young automobile industry. Because of its geographical characteristics, Algonquin was the perfect place to test the quality of new car models. Basically, if the vehicle could climb the hills of Algonquin, it was golden! The testing turned into a national event and successful automobiles were awarded the 'Algonquin Cup.' Needless to say, the hills are no longer used to evaluate cars, but a park was established at one the sites in 2004 and fittingly designated Hill Climb Park.
Today Algonquin is a vital community with a good school system, successful commercial corridors, and several residential neighborhoods with a variety of housing options and prices.
find your Algonquin home now
Algonquin Real Estate
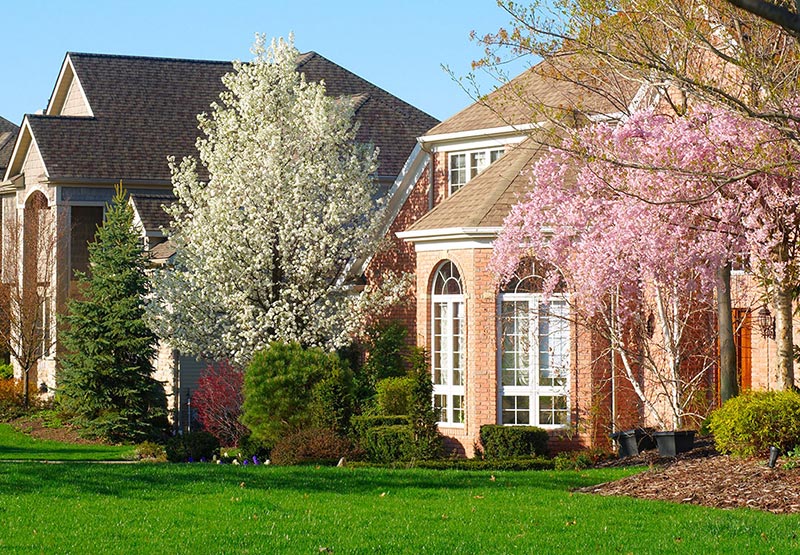
Residential real estate in Algonquin varies from older one-story houses to large new construction homes with modern amenities. Towering trees and privacy hedges provide natural barriers between properties and offer homeowners stunning lots that enhance the value of their homes. Algonquin neighborhoods are tucked in among the forested strips that surround the river tributaries throughout the village. Snaking residential roads and secluded subdivisions ensure a nice, safe setting excellent for families with children and folks who enjoy a spacious and peaceful locale.
Prices for detached single-family houses in Algonquin vary greatly, depending on the type and age of the property. Home buyers who like vintage charm will find 50 to 100-year-old real estate in great condition with affordable price tags. One-story homes with a bit of wear under their belts start in the mid $100,000s. Two-level houses in Algonquin are generally priced in the $200,000s and $300,000s. Newer constructions typically cost more and offer buyers upgraded appliances and fine interior finishes. Top-dollar real estate in Algonquin reaches into the $600,000s, with a few waterfront properties listed in the $800,000 to $1 million range.
Private residences dominate the Algonquin real estate scene, however, there are a number of condo and townhome developments, as well. For the most part, attached properties in Algonquin run between $150,000 and $300,000.
Algonquin market trends
Average sales price
The average sale price of a home in Algonquin is represented by the chart to the right. The red line indicates the average price based on the total time frame selected in the drop-down window. The blue line indicates the average sale price for the particular month within that time frame. For more detailed information on Algonquin sign up for the trends report below or contact your Dream Town broker.
Average market time
The average number of days a home in Algonquin spends listed for sale is represented by the chart to the right. The red line indicates the average number of days based on the total time frame selected in the drop-down window. The blue line indicates the average number of days a home spent on market during the particular month within that time frame. For more detailed information on average market listing times in Algonquin sign up for the trends report below or contact your Dream Town broker.
Sales price vs. list price
The average sale price of a home compared to its listing price in Algonquin is represented by the chart to the right. The black line indicates the baseline listing price for homes during the time frame selected in the drop-down. The red line indicates the difference between the average listing price and the average sale price during the particular month within that time frame. For more detailed information on Algonquin sign up for the trends report below or contact your Dream Town broker.
Number of listings
The total number of listings in Algonquin is represented in the chart to the right. The red line represents average number of days based on the total time frame selected in the drop-down window The blue bar represents the current number of listings during the particular month of that time frame. For more detailed information on Algonquin sign up for the trends report below or contact your Dream Town broker.
Get the latest trends delivered straight to your inbox
Thinking about making a move? Be prepared with a comprehensive look at the area market, delivered directly to your email every month. And don’t forget to contact your Dream Town broker if you’d like to discuss what this data means for your next move!


